Astute Inspect Overview
Astute Inspect is the fastest way to understand what is happening inside a DDS domain without switching between logs, packet captures, and ad-hoc scripts.
It gives developers a live operational picture of:
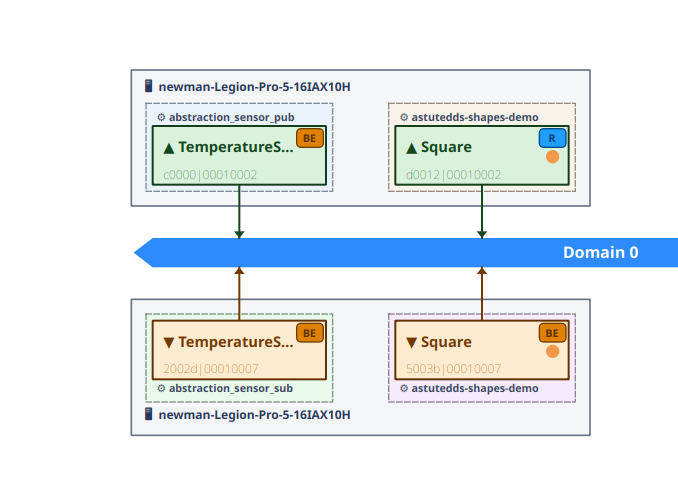
- who is publishing and subscribing
- what QoS each endpoint actually offers/requests
- whether endpoints are matched or mismatched
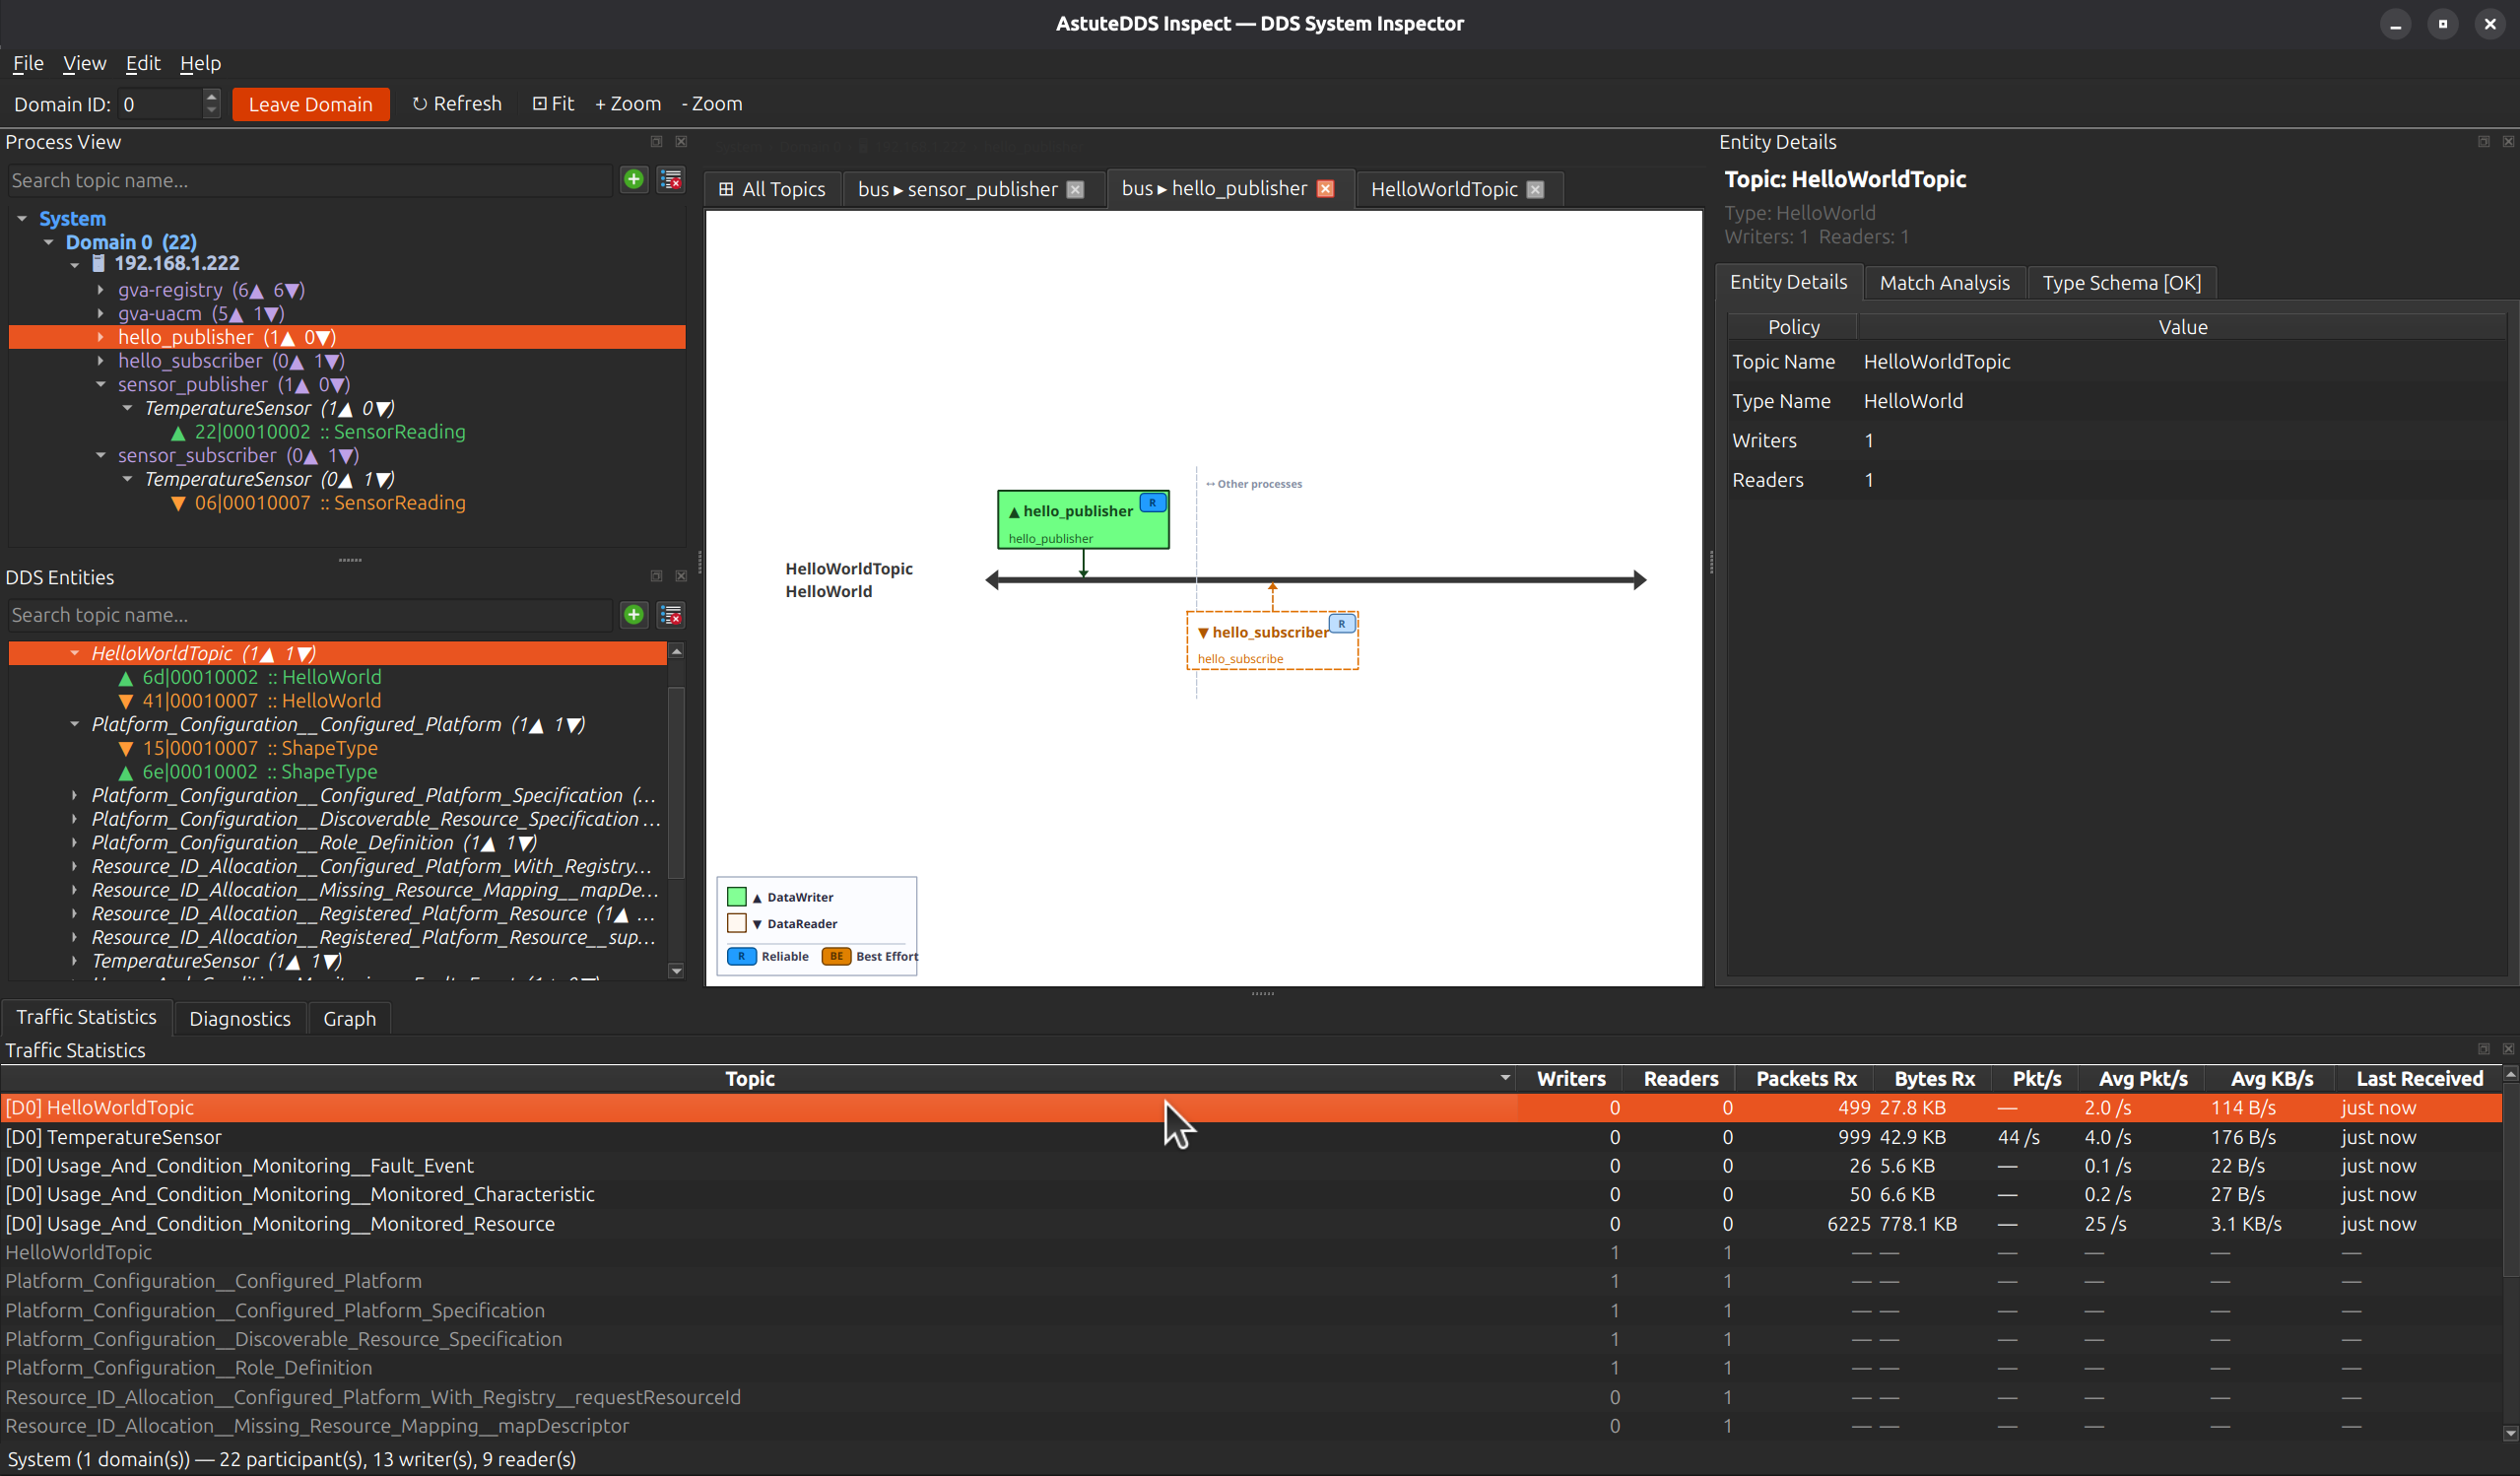
- how much traffic each topic is moving
- what values are flowing through selected fields
This directly reduces investigation time during integration, interoperability testing, and production diagnostics.
Install Astute Inspect from the dedicated Installation page.
Documentation Map
Use this section in the following order:
- Installation for OS-specific package setup
- Overview for product value and architecture of the workspace
- Feature Tour for pane-by-pane capability details
- Live Analysis Workflows for repeatable debugging playbooks
This structure is designed so new users can go from first launch to practical troubleshooting quickly.
Why Teams Adopt It
1. Faster Root-Cause Analysis
Instead of asking "is this a network problem, a QoS problem, or a type problem?", Astute Inspect lets you answer in one screen by combining:
- topology context
- endpoint-level QoS evidence
- diagnostics feed
- real traffic rates
2. Interop Confidence During Vendor Mixes
When running AstuteDDS with other DDS stacks, Astute Inspect highlights where behavior diverges, including endpoint matching and QoS compatibility.
3. Better Signal for Large Systems
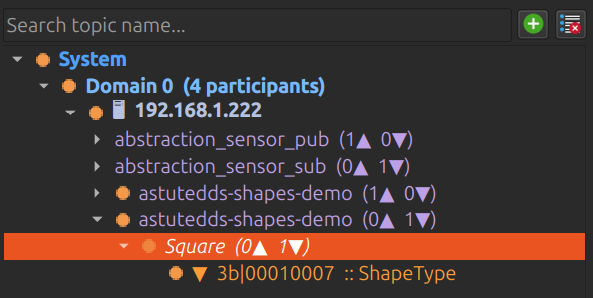
Process View and DDS Entities filtering let developers isolate one process or topic quickly, instead of manually scanning thousands of entities.
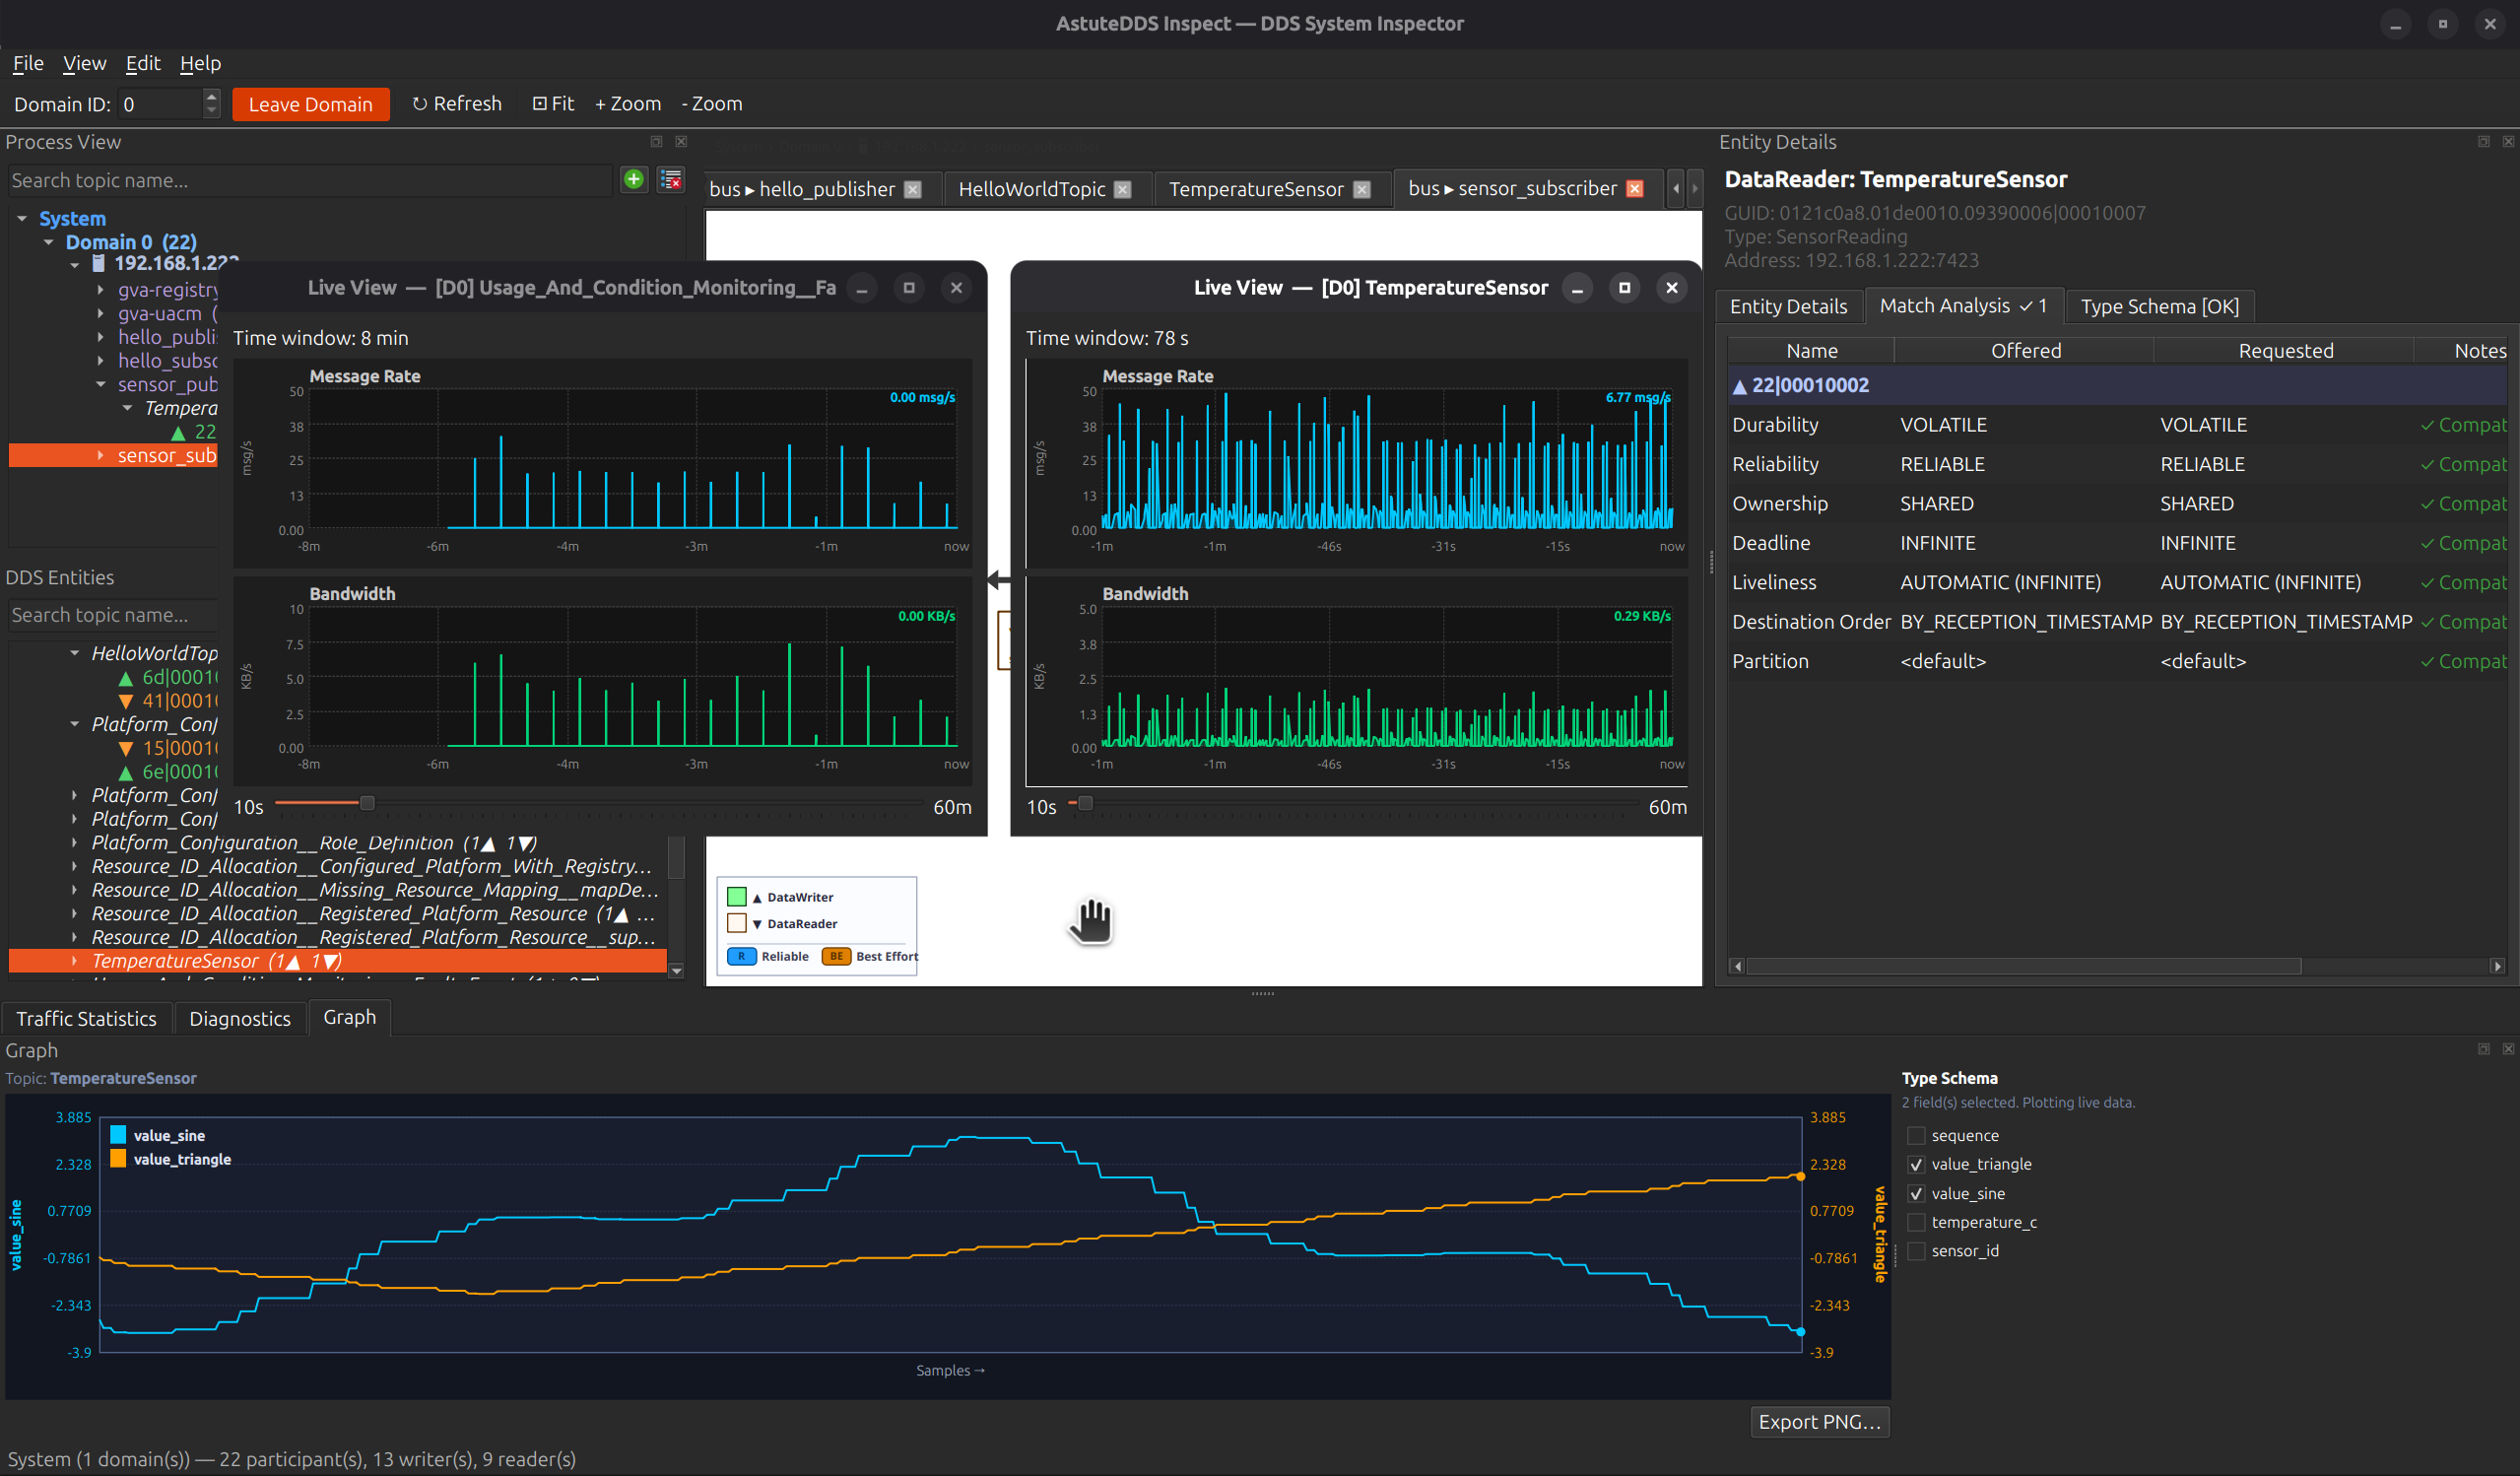
Core Workspace Layout
Astute Inspect is optimized for parallel debugging workflows:
- Left: Process View and DDS Entities trees with search
- Center: topology canvas with tabbed diagrams
- Right: Entity Details, Match Analysis, and Type Schema
- Bottom: Traffic Statistics, Diagnostics, and Graph tabs
What You Can Resolve Quickly
- Missing data because readers and writers never match
- QoS incompatibilities that silently block communication
- Throughput regressions after code or configuration changes
- Topic-level behavior changes across releases
- Type/schema confusion in mixed IDL and non-IDL environments
Practical Developer Impact
- Shorter integration cycles because mismatches are visible immediately
- Faster triage because topology, diagnostics, QoS, and traffic are correlated in one workspace
- Better release confidence through screenshot-backed evidence for regressions and fixes
Continue to Feature Tour for a deep walkthrough of each pane and to Live Analysis Workflows for practical investigation playbooks.