Astute DDS Inspect
Astute Inspect is an advanced, next-generation DDS diagnostics and visualization platform designed for modern distributed systems. Unlike traditional tools, Astute Inspect delivers unified, real-time insight across all DDS domains, vendors, and security layers—empowering you to monitor, analyze, and troubleshoot your entire data ecosystem with unmatched clarity and speed.
With interactive live topology maps, deep data and type introspection, automated QoS and security analysis, and seamless process/network tracing, Astute Inspect transforms complex DDS environments into actionable, intuitive visualizations. Instantly detect issues, explore data flows, and generate comprehensive reports—all in a streamlined, extensible interface built for both development and production.
Astute Inspect redefines DDS observability, dramatically reducing troubleshooting time and enabling proactive system optimization at every stage of your application lifecycle.
Features
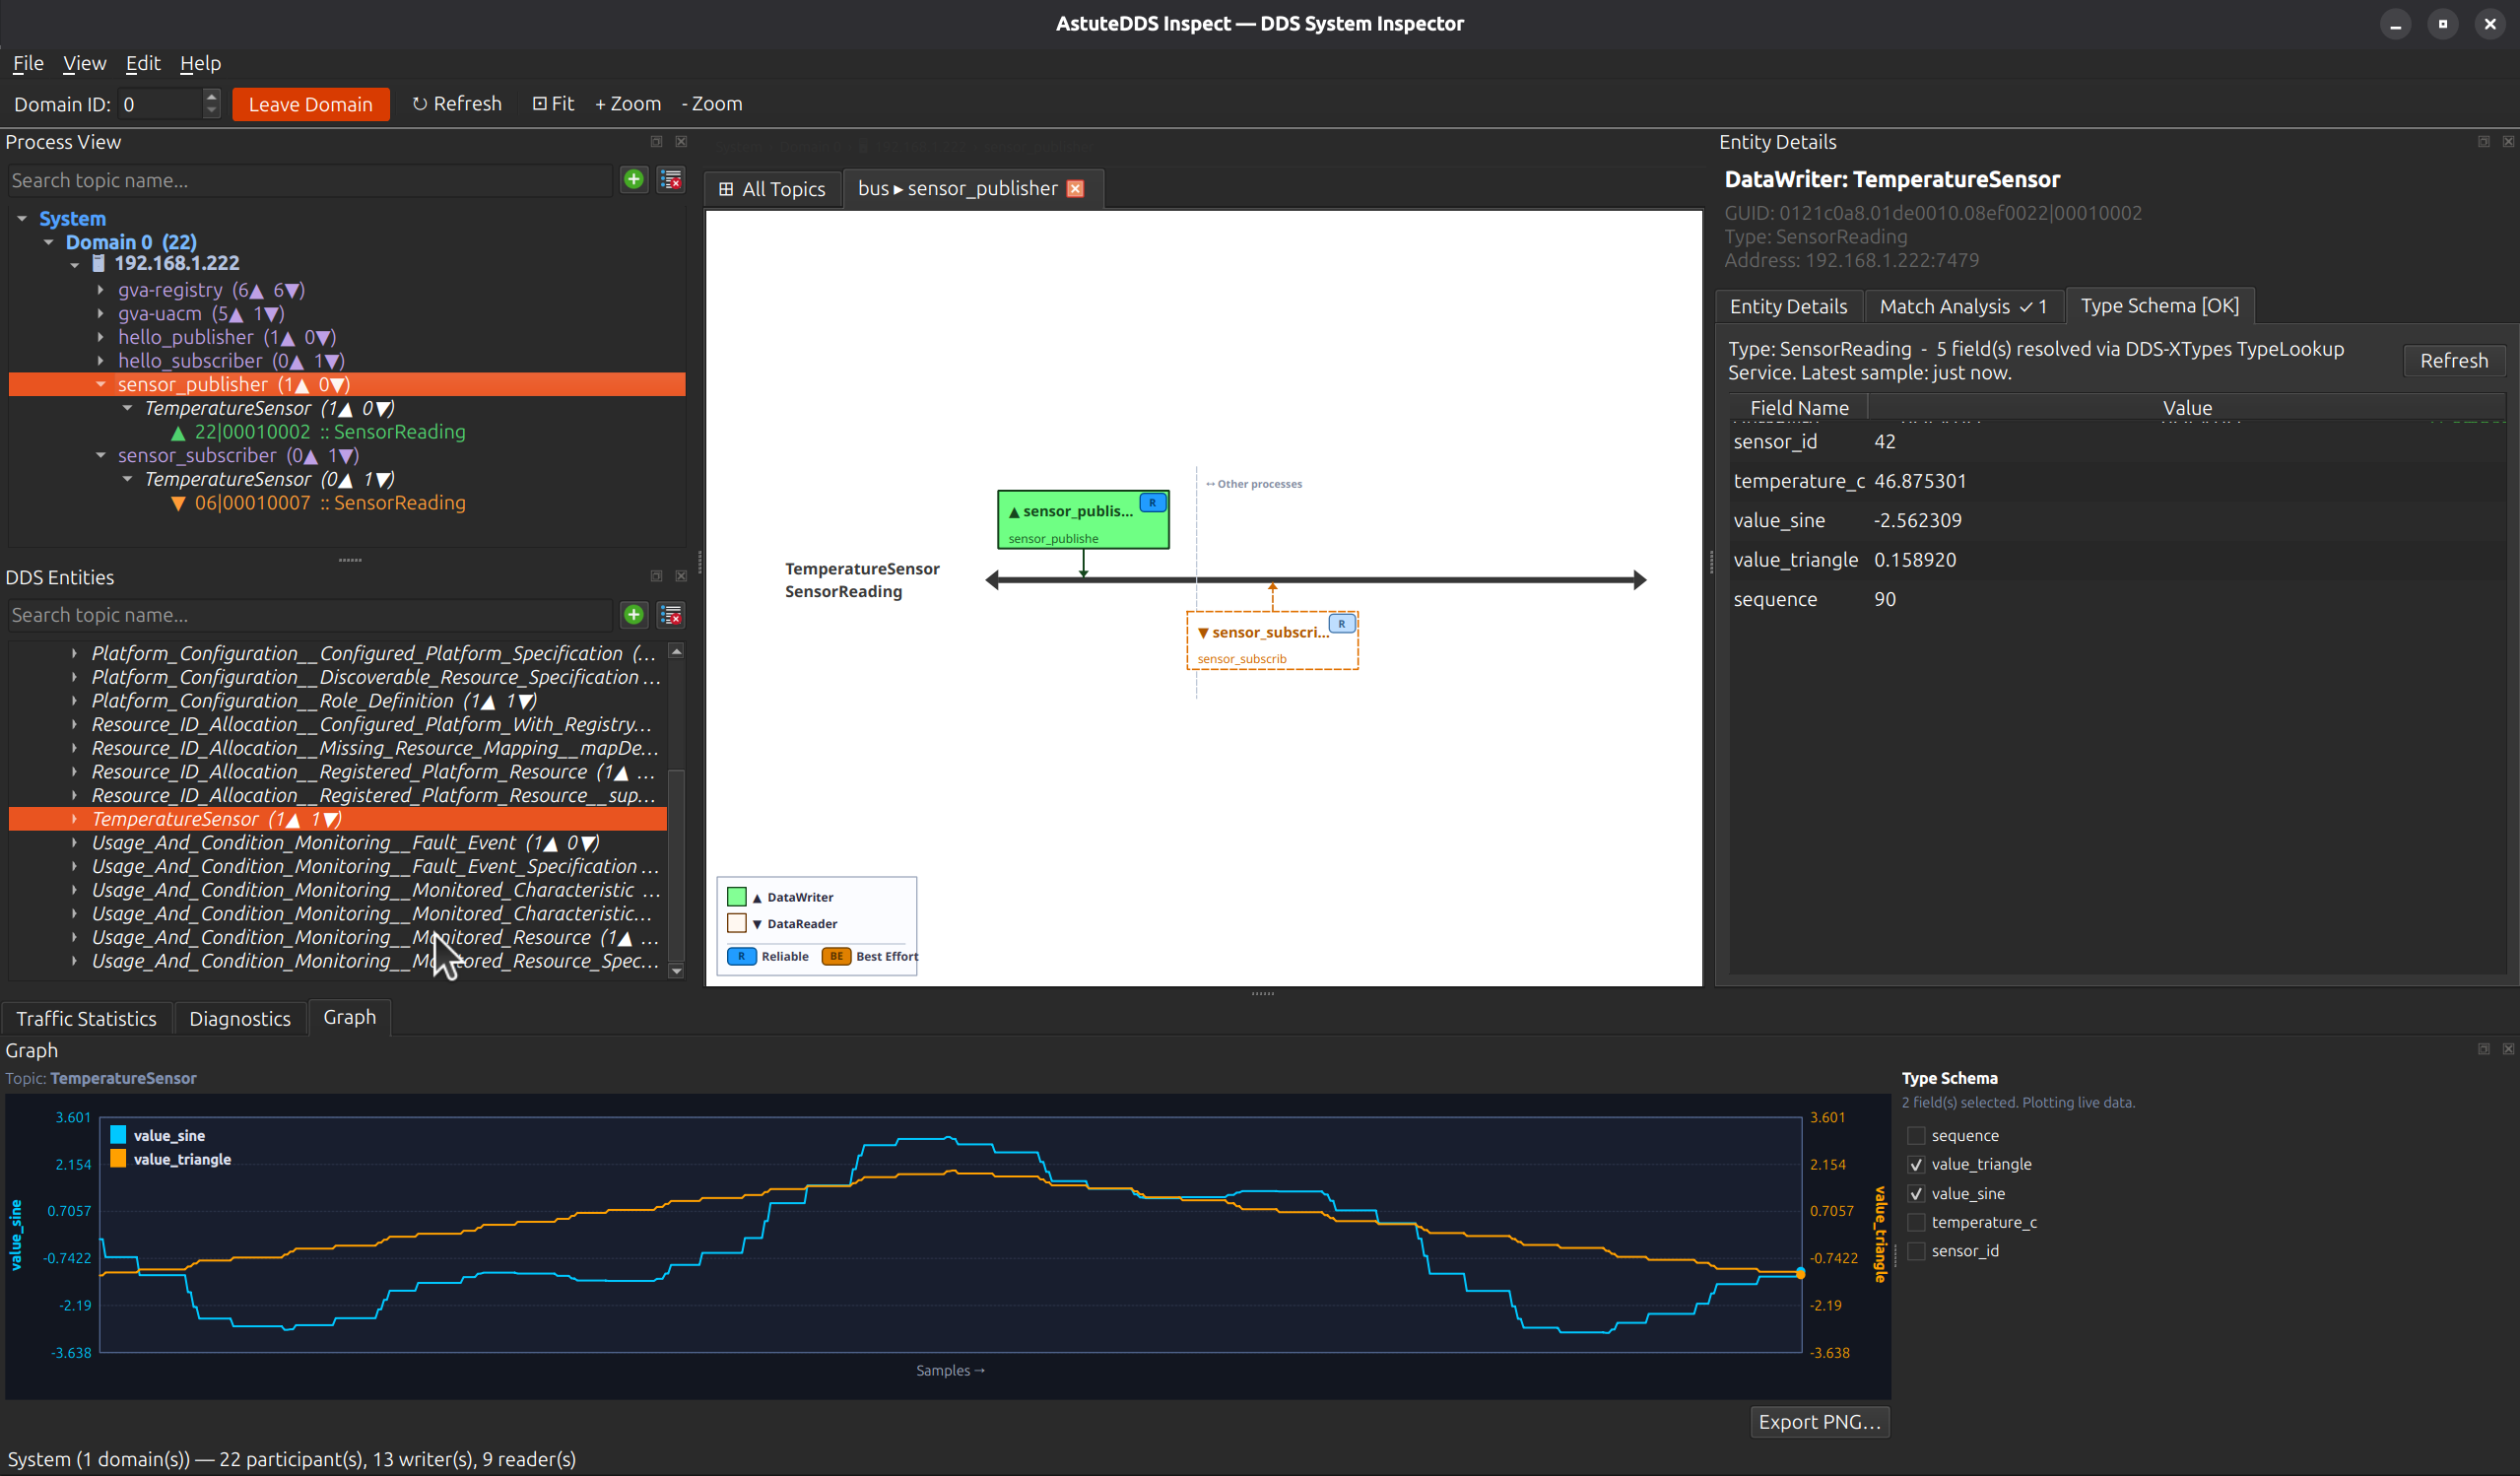
- Entity Tree View: Hierarchical display of Domains → Participants → DataWriters/DataReaders.
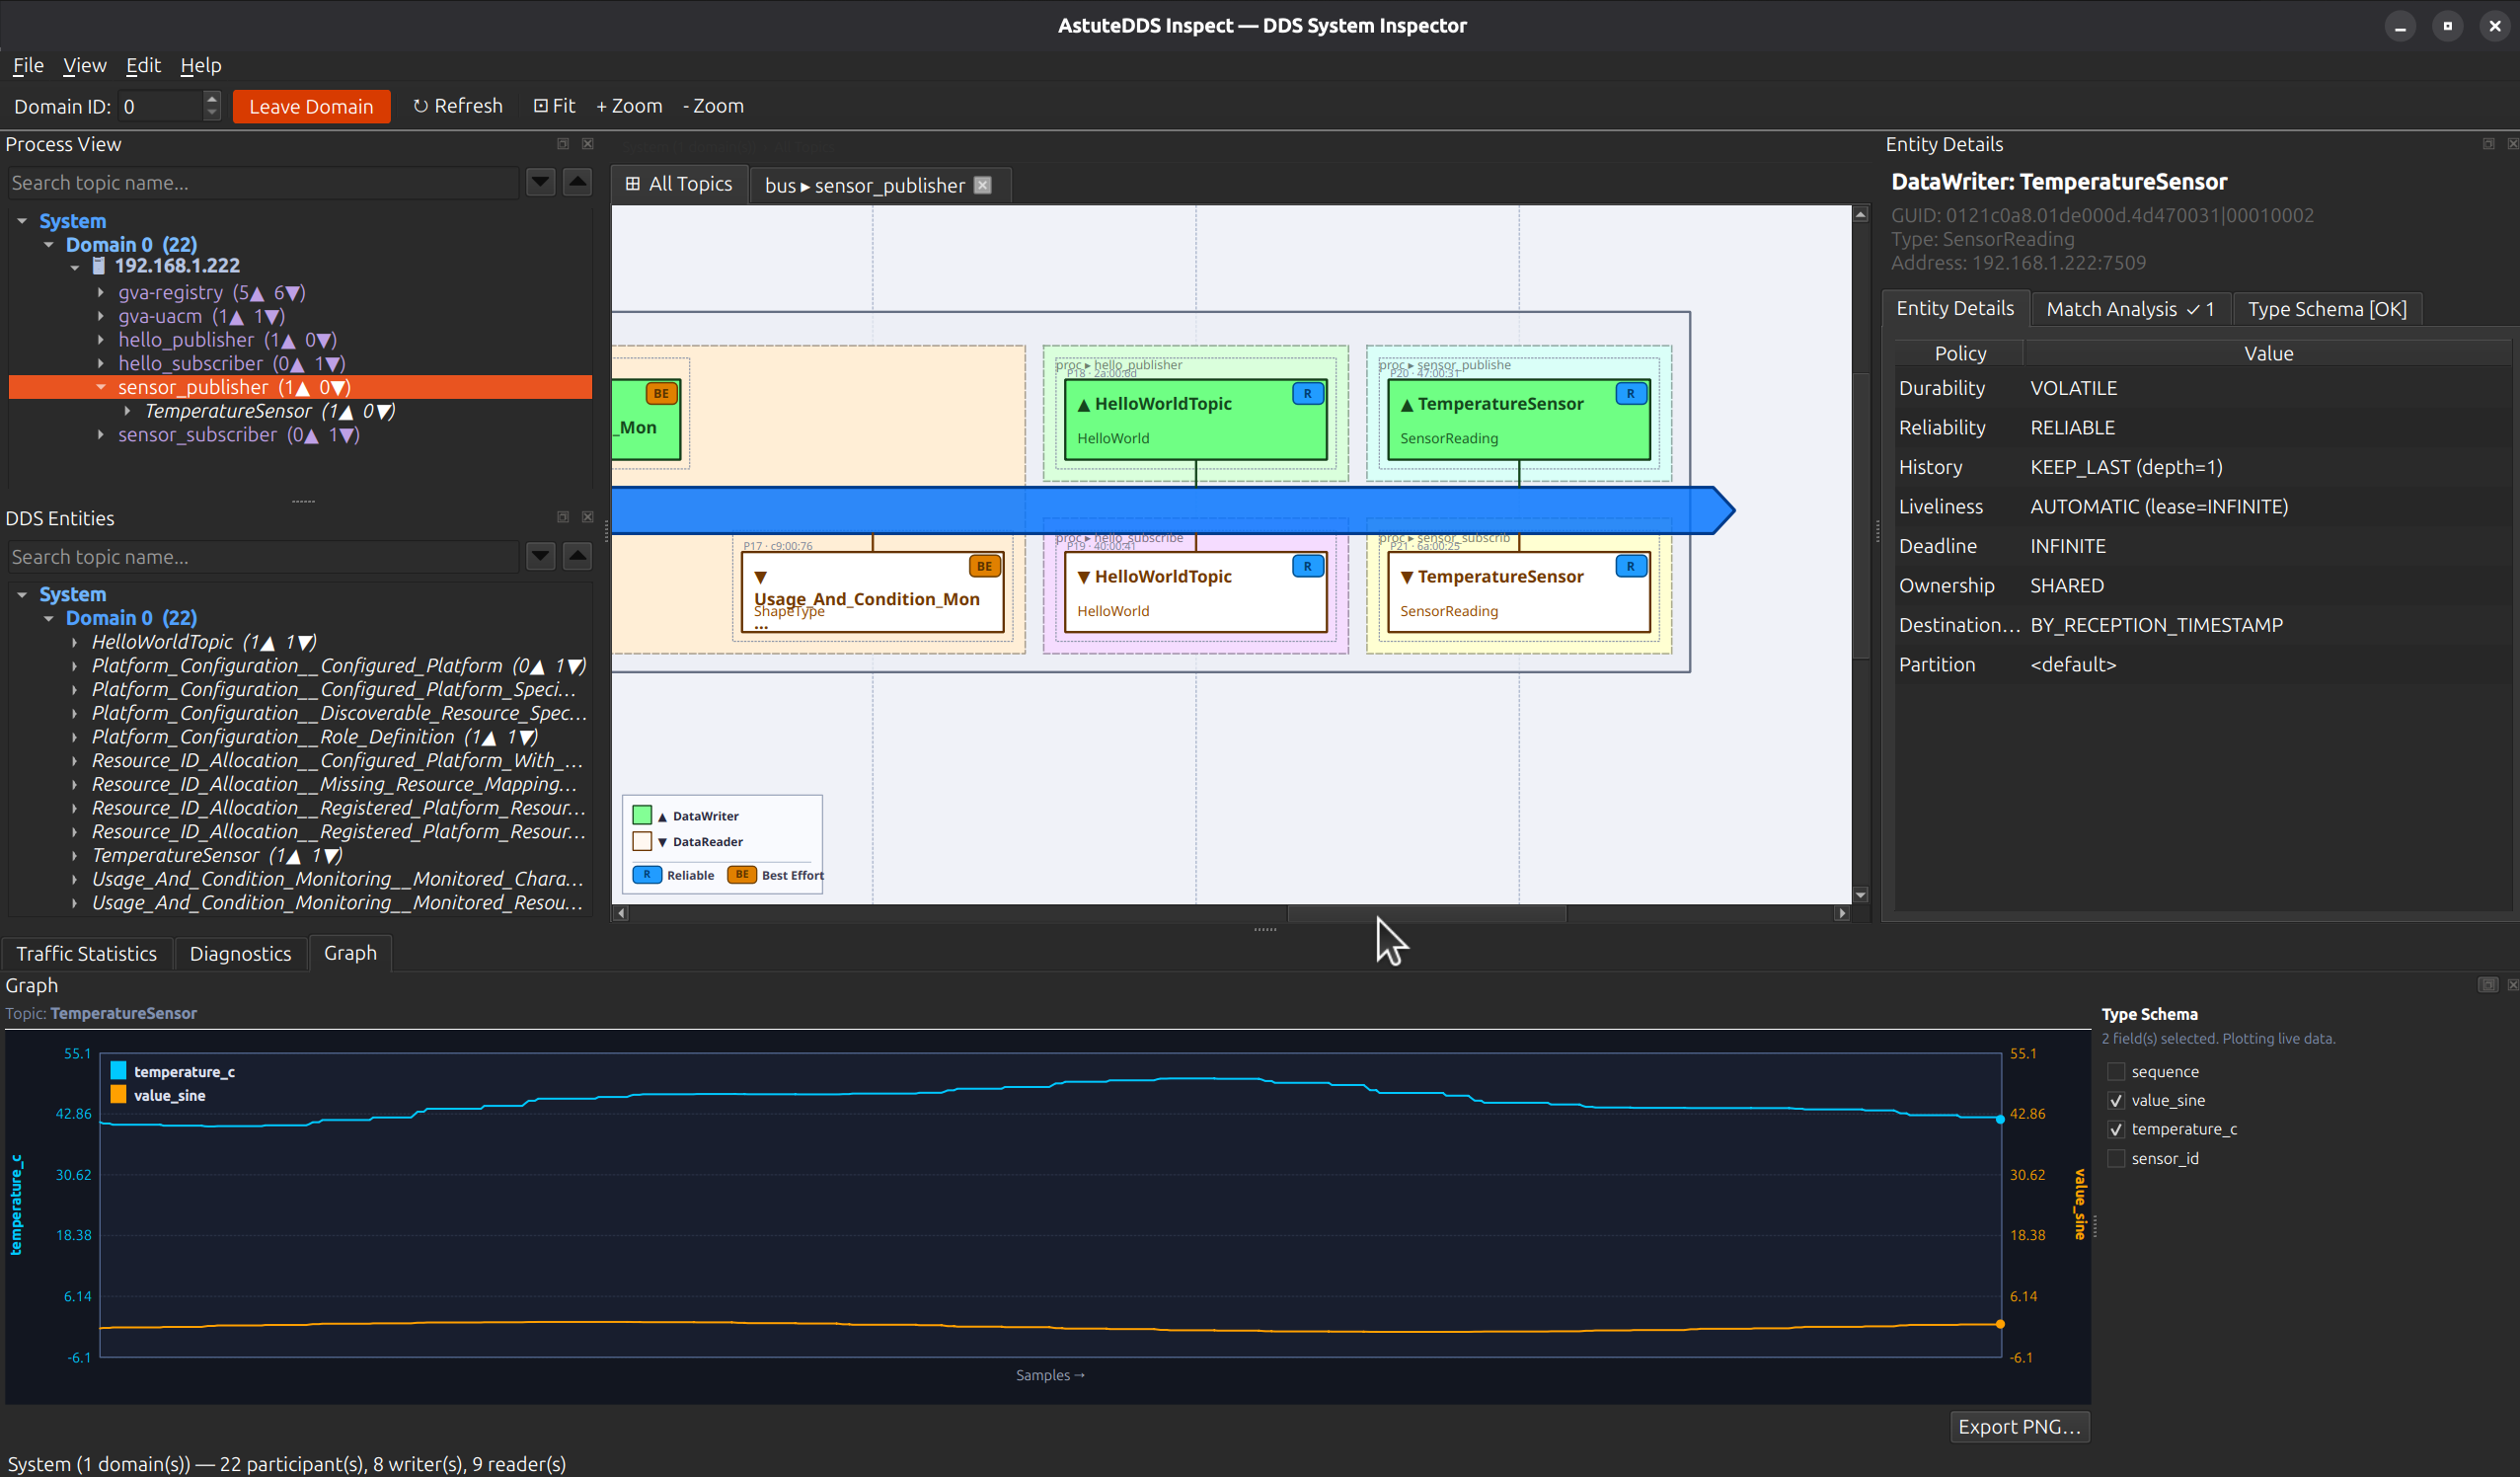
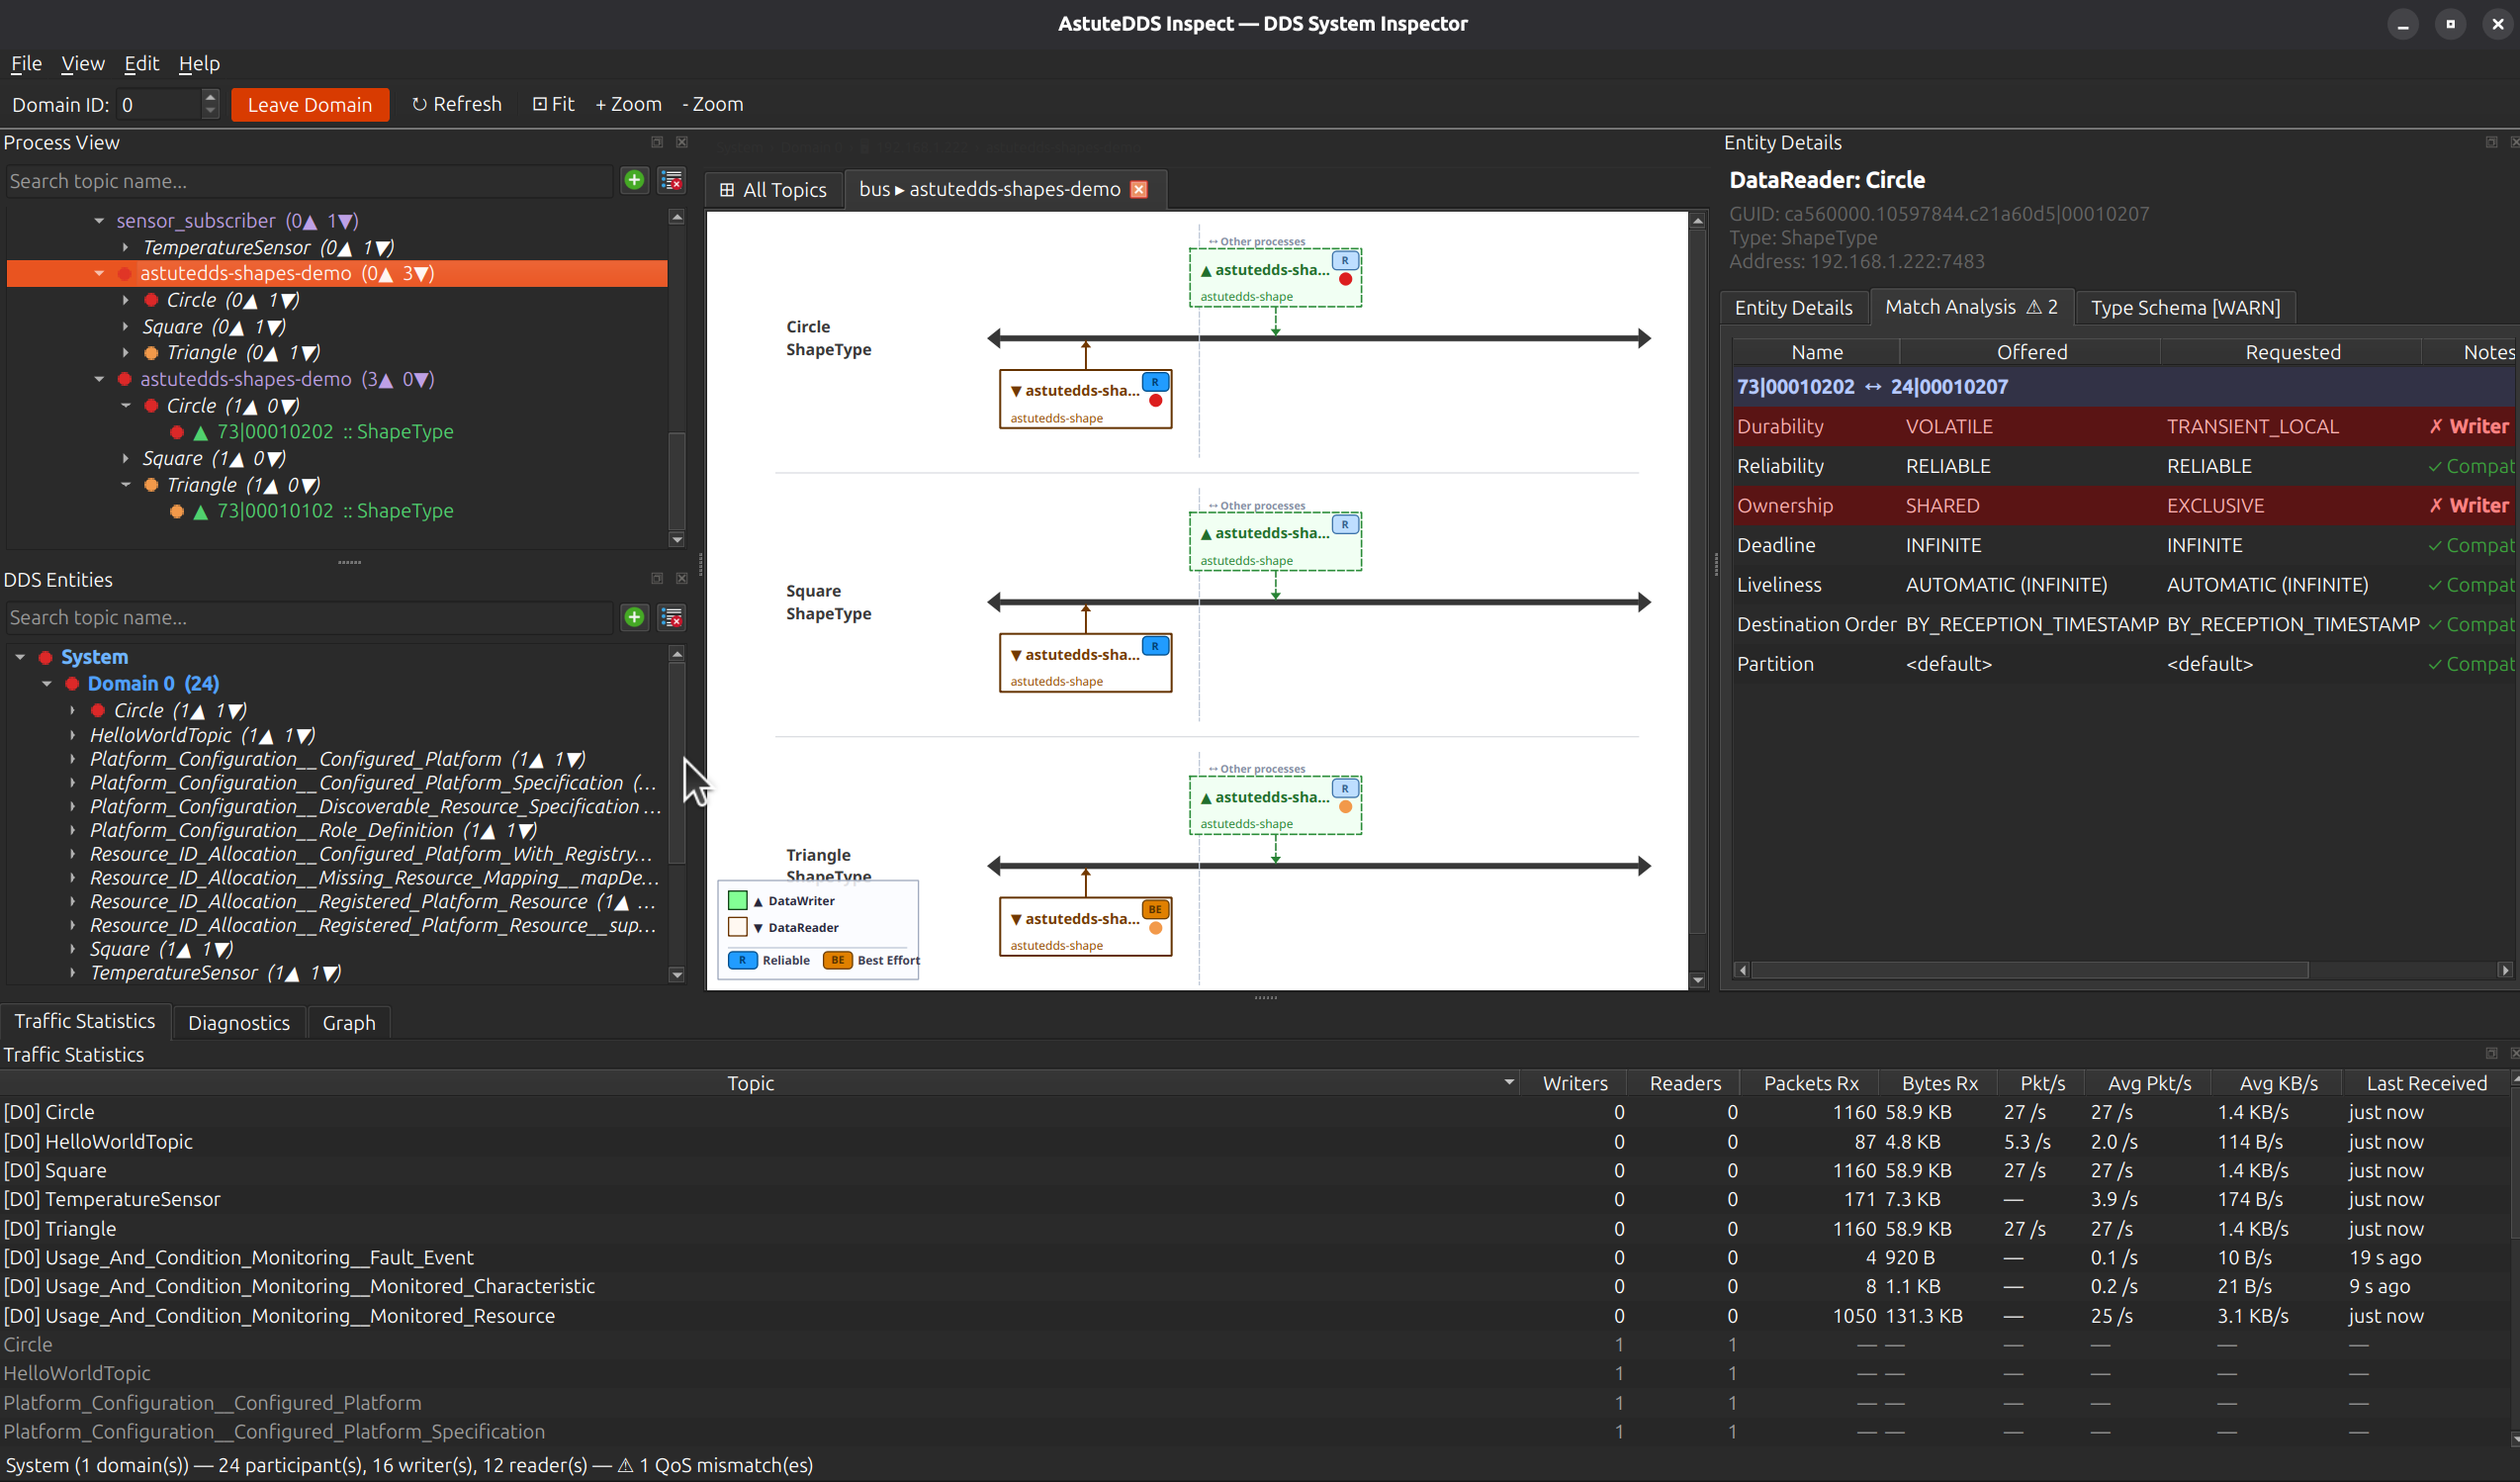
- Topology Graph: Visualizes participants and endpoints, with colored nodes and arrows for compatible/incompatible matches.
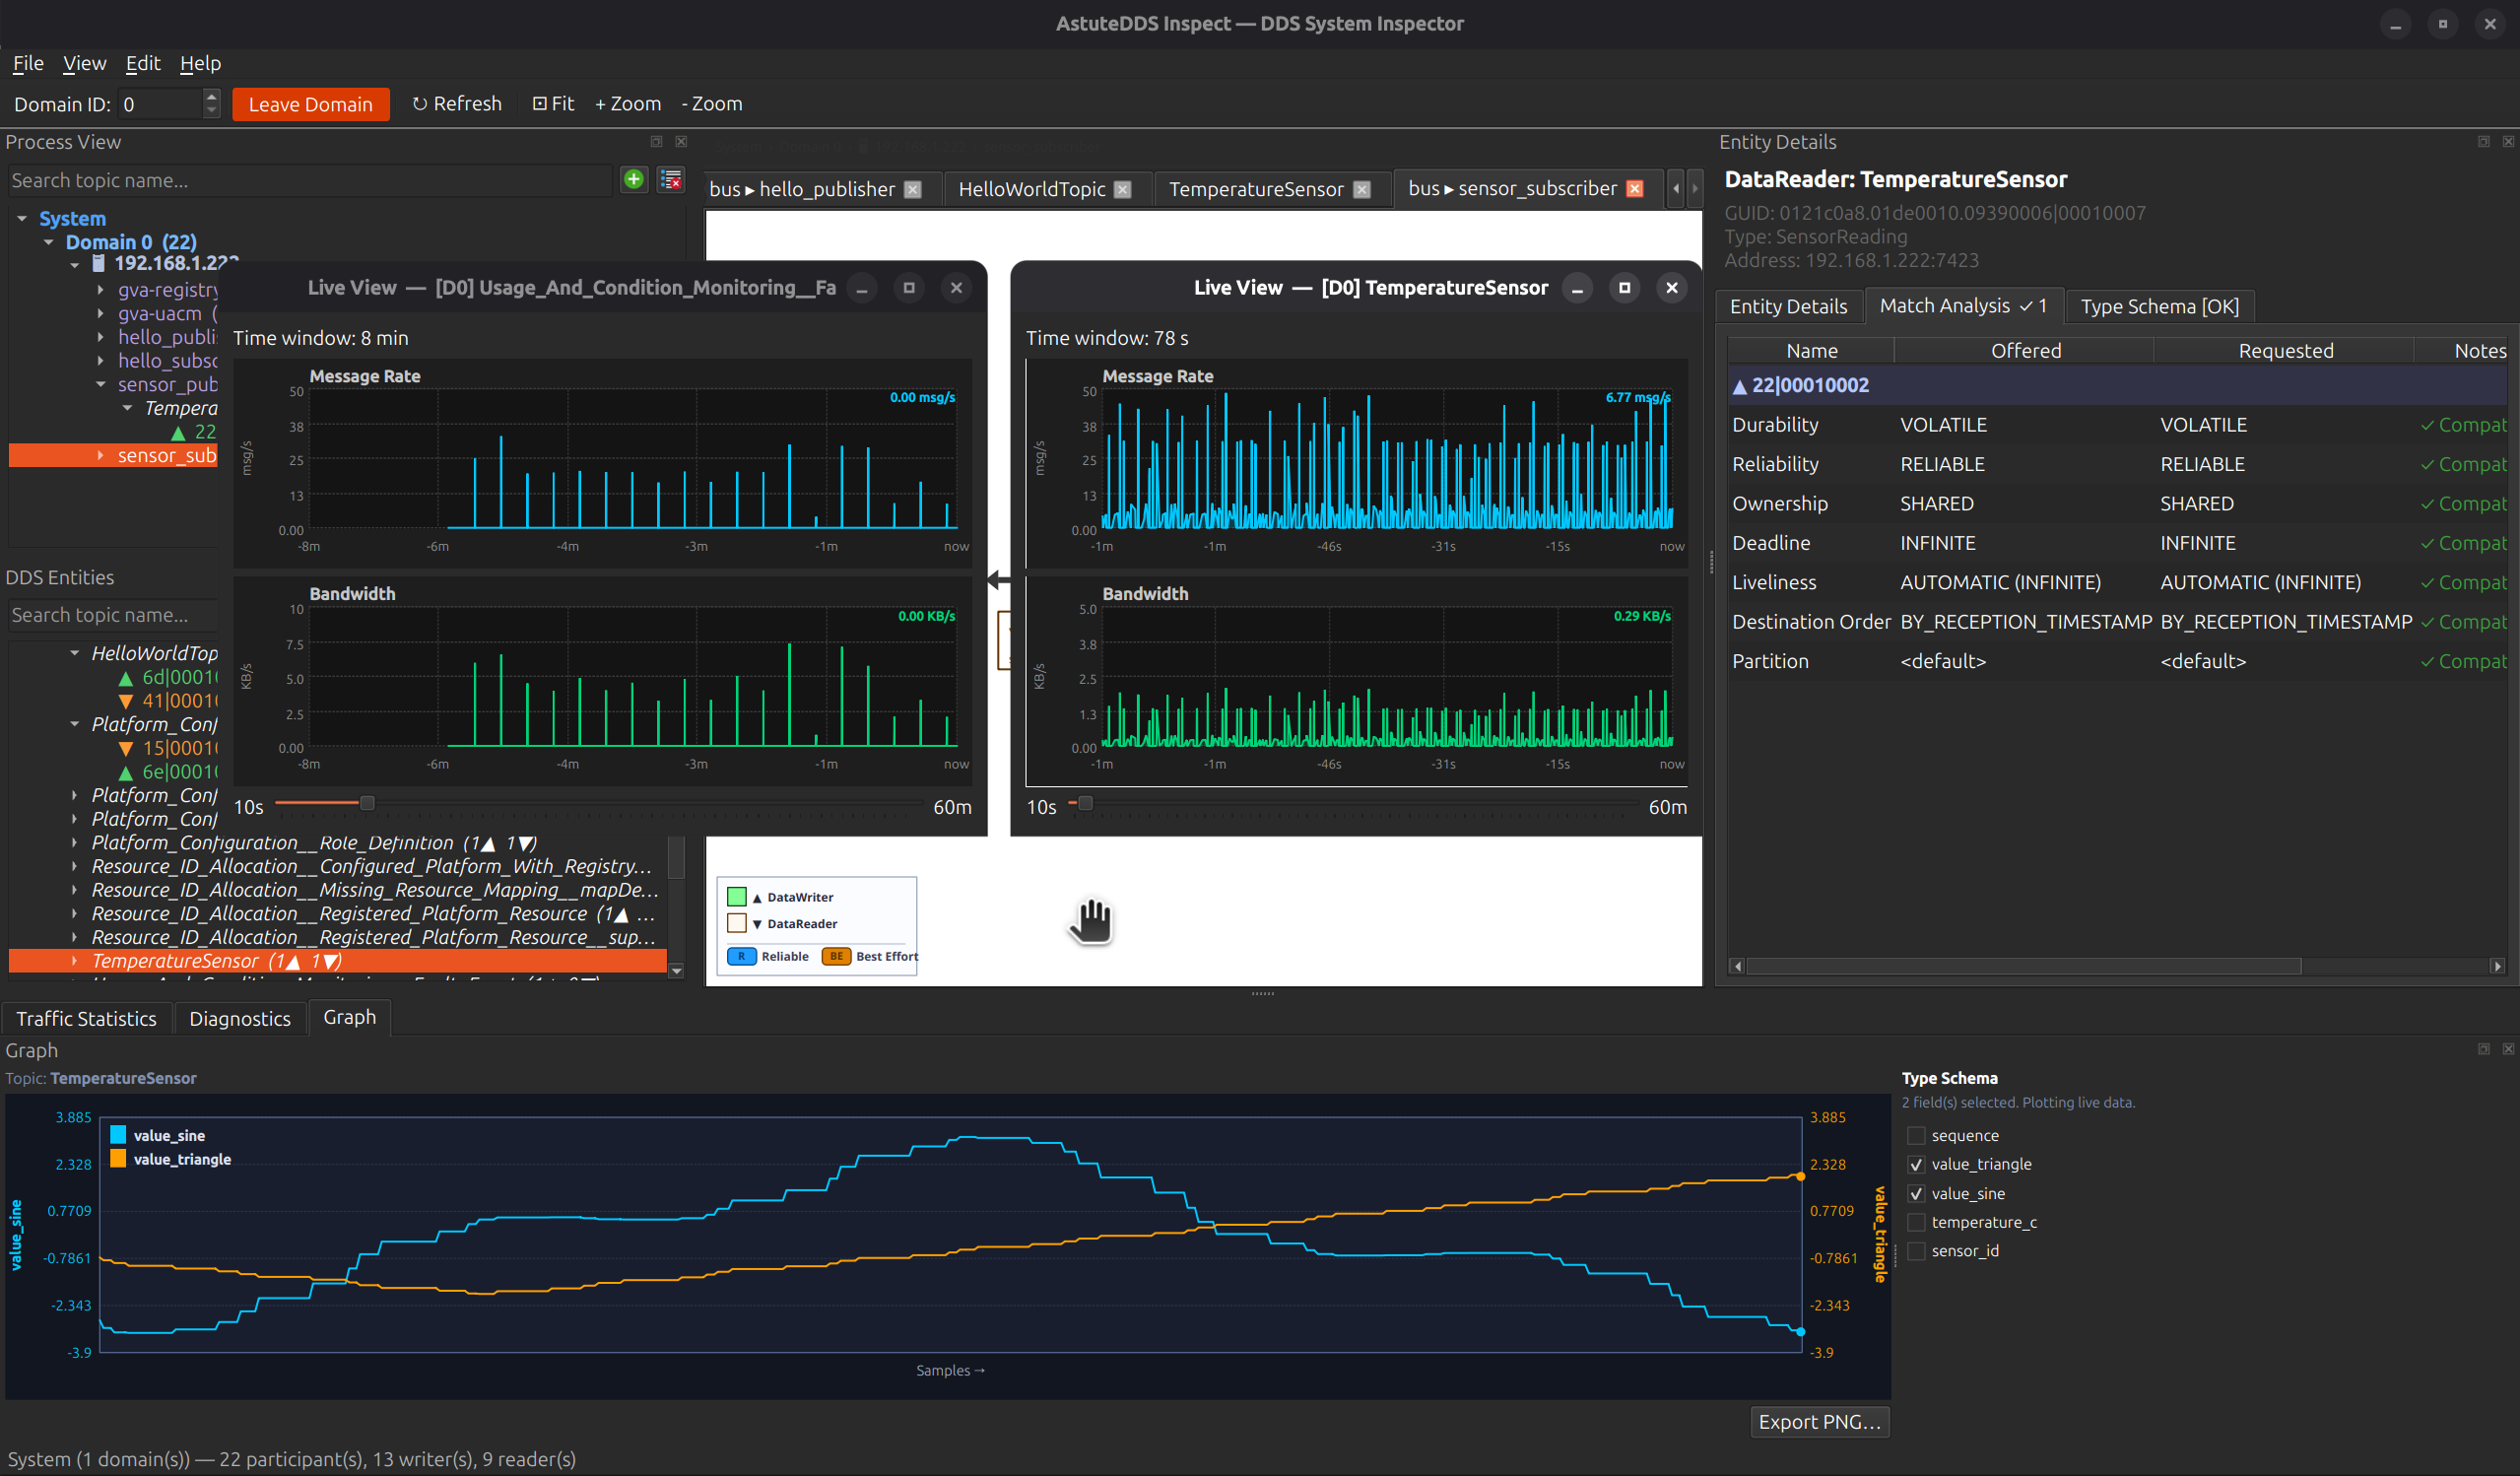
- QoS Compatibility Analysis: Checks 7 core DDS policies (Durability, Reliability, Ownership, Deadline, Liveliness, Destination Order, Partition) and highlights mismatches.
- Entity Detail Panel: Shows GUID, addresses, ports, QoS table, and match results for selected entities.
- Diagnostics Log: 5000-entry circular buffer with color-coded severity, filtering, and CSV export.
- Domain Join/Leave: Join or leave domains via CLI or toolbar, with auto-refresh at 1 Hz.
- Entity Metrics Summary: Aggregate counters for domains, topics, participants, writers, and readers.
- Multi-Domain Support: View multiple domains in a single workspace (System root with Domain children).
- Product Version Detection: Detects and displays product versions for interop/debugging.
- Dynamic Topic Discovery: No hardcoded topic list; discovers all topics and endpoints live.
- Passive Discovery: Reads RTPS traffic without injecting messages.
- Export/Snapshot: Export current topology as JSON/XML and CSV; diagnostics log export.
- Theming: Dark mode and color-coded health indicators.
- Auto-Join from CLI: --auto-join and --domain arguments for immediate connection.
- Process View: Filter and isolate entities by process for large systems.
- Traffic Statistics Panel: Live message and throughput stats per topic/endpoint.
Screenshots